
Please Wait.....

Report

Agricultural Commodity Market By Product (Cereals, Grains, Oilseeds, Pulses, Others), By Nature (Organic, Conventional), By Distributional Channel (Hypermarkets/Supermarkets, Convenience Stores, E-commerce, Others): Global Opportunity Analysis and Industry Forecast, 2023-2032
Market Report I 2024-04-01 I 315 Pages I Allied Market Research
The global�agricultural commodity�market is anticipated to reach $2,206.2 billion by 2032, growing from $1,621.2 billion in 2022 at a CAGR of 3.2% from 2023 to 2032.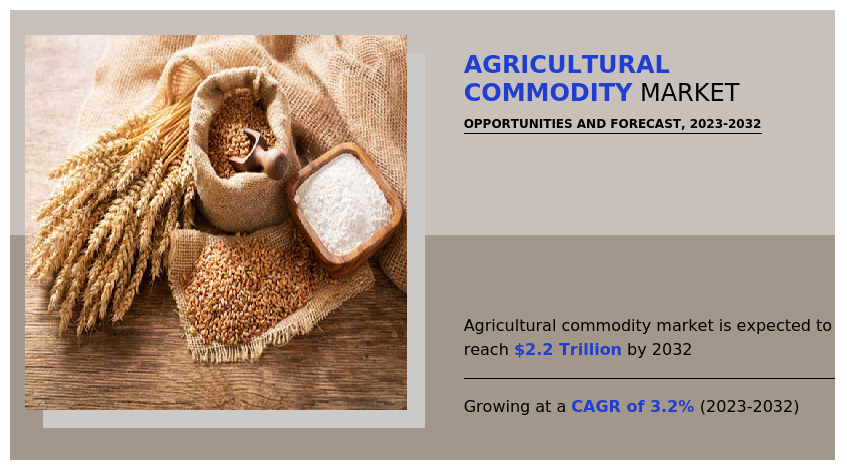 Agricultural commodities form the backbone of numerous industries, spanning from food processing to textiles and biofuels. These raw materials, sourced from farming activities, encompass a broad spectrum, including grains like wheat, rice, and corn, oilseeds such as soybeans, and livestock products like meat and dairy. Cultivation practices are diverse, influenced by factors like climate and soil, with technology and capital playing crucial roles. The global food supply chain heavily relies on these commodities, which serve as vital inputs across sectors. Trading in agricultural commodities is facilitated through various avenues, including spot markets and futures contracts. This intricate system, driven by natural resources, labor, and technological advancements, ensures a steady flow of essential goods to meet the demands of a growing population and diverse industries.Government policies and subsidies play a pivotal role in shaping the agricultural commodity market dynamics. Subsidies act as powerful stimuli, guiding the choices of farmers and agribusinesses by offering financial support and incentives, thus influencing production levels and market prices. Moreover, they serve to mitigate risks inherent in agricultural ventures, promoting industry stability. Concurrently, trade policies wield significant influence by regulating the flow of agricultural goods across borders through tariffs, import/export regulations, and support programs. These policies determine market accessibility and product competitiveness, impacting global supply and demand equilibrium. Consequently, shifts in governmental strategies resonate throughout the agricultural commodity landscape, influencing market trends, investment decisions, and the economic prosperity of nations reliant on agriculture.The inadequate transportation networks, storage facilities, and infrastructure pose significant challenges to the agricultural commodity market expansion. Due to inadequate transportation systems, timely delivery to markets becomes a difficult task, disrupting the supply chain and causing potential spoilage. The absence of proper infrastructure not only impedes efficient logistics but also increases costs along the agricultural value chain, impacting prices and profitability for farmers and stakeholders. Addressing these pressing issues becomes paramount to ensure the smooth flow of agricultural products and maintain market stability. Without swift measure to enhance transportation, storage, and infrastructure capabilities, the agricultural commodity market is poised to face restrained growth in the future.The integration of technological innovations is projected to create several growth opportunities for the key players operating in the market. Genetically modified crops, precision farming techniques, and mechanization are revolutionizing agriculture, promising increased productivity and efficiency. Genetically engineered crops resistant to pests and adverse weather conditions reduce reliance on costly chemical inputs, while precision farming, aided by drones and GPS, optimizes resource allocation and minimizes waste. Mechanization streamlines labor-intensive tasks, enabling scalability and higher output capacity. These advancements not only boost yields but also stabilize supply levels, influencing commodity prices. Moreover, they pave the way for sustainable practices, meeting consumer and regulatory demands for eco-friendly farming methods. From reducing carbon footprint to conserving water, such practices align with market preferences, opening doors for environmentally conscious agricultural products. In essence, the convergence of agriculture and technology offers key players the opportunity to capitalize on enhanced productivity, cost savings, and sustainability, shaping the future dynamics of the market.The key players profiled in this report include Louis Dreyfus, Cofco, Olam International, Cargill Incorporated, Ag Processing Inc, Marubeni Corporation, Wilmar International Limited, Archer Daniels Midland, Glencore Agriculture, and Bunge Limited. The market players are continuously striving to achieve a dominant position in this competitive market using strategies such as collaborations and product launches.
Key Benefits For Stakeholders
-This report provides a quantitative analysis of the market segments, current trends, estimations, and dynamics of the agricultural commodity market analysis from 2022 to 2032 to identify the prevailing agricultural commodity market opportunities.
-The market research is offered along with information related to key drivers, restraints, and opportunities.
-Porter's five forces analysis highlights the potency of buyers and suppliers to enable stakeholders make profit-oriented business decisions and strengthen their supplier-buyer network.
-In-depth analysis of the agricultural commodity market segmentation assists to determine the prevailing market opportunities.
-Major countries in each region are mapped according to their revenue contribution to the global market.
-Market player positioning facilitates benchmarking and provides a clear understanding of the present position of the market players.
-The report includes the analysis of the regional as well as global agricultural commodity market trends, key players, market segments, application areas, and market growth strategies.
Additional benefits you will get with this purchase are:
- Quarterly Update and* (only available with a corporate license, on listed price)
- 5 additional Company Profile of client Choice pre- or Post-purchase, as a free update.
- Free Upcoming Version on the Purchase of Five and Enterprise User License.
- 16 analyst hours of support* (post-purchase, if you find additional data requirements upon review of the report, you may receive support amounting to 16 analyst hours to solve questions, and post-sale queries)
- 15% Free Customization* (in case the scope or segment of the report does not match your requirements, 15% is equivalent to 3 working days of free work, applicable once)
- Free data Pack on the Five and Enterprise User License. (Excel version of the report)
- Free Updated report if the report is 6-12 months old or older.
- 24-hour priority response*
- Free Industry updates and white papers.Possible Customization with this report (with additional cost and timeline, please talk to the sales executive to know more)
- Investment Opportunities
- Product Benchmarking / Product specification and applications
- Scenario Analysis & Growth Trend Comparison
- Supply Chain Analysis & Vendor Margins
- Upcoming/New Entrant by Regions
- Technology Trend Analysis
- Market share analysis of players by products/segments
- New Product Development/ Product Matrix of Key Players
- Regulatory Guidelines
- Additional company profiles with specific to client's interest
- Additional country or region analysis- market size and forecast
- Average Selling Price Analysis / Price Point Analysis
- Criss-cross segment analysis- market size and forecast
- Expanded list for Company Profiles
- Historic market data
- Import Export Analysis/Data
- Key player details (including location, contact details, supplier/vendor network etc. in excel format)
- Market share analysis of players at global/region/country level
- SWOT Analysis
Key Market Segments
By Product
- Cereals
- Grains
- Oilseeds
- Pulses
- Others
By Nature
- Organic
- Conventional
By Distributional Channel
- Hypermarkets/Supermarkets
- Convenience Stores
- E-commerce
- Others
By Region
- North America
- U.S.
- Canada
- Mexico
- Europe
- Germany
- UK
- France
- Spain
- Italy
- Rest of Europe
- Asia-Pacific
- China
- Japan
- India
- South Korea
- Australia
- Rest of Asia-Pacific
- LAMEA
- Brazil
- Saudi Arabia
- UAE
- South Africa
- Rest of LAMEA
- Key Market Players
- Louis Dreyfus
- Cofco
- Olam International
- Cargill Incorporated
- Ag Processing Inc.
- Marubeni Corporation
- Wilmar International Limited
- Archer Daniels Midland
- Glencore Agriculture
- Bunge Limited
CHAPTER 1: INTRODUCTION
1.1. Report description
1.2. Key market segments
1.3. Key benefits to the stakeholders
1.4. Research methodology
1.4.1. Primary research
1.4.2. Secondary research
1.4.3. Analyst tools and models
CHAPTER 2: EXECUTIVE SUMMARY
2.1. CXO perspective
CHAPTER 3: MARKET OVERVIEW
3.1. Market definition and scope
3.2. Key findings
3.2.1. Top impacting factors
3.2.2. Top investment pockets
3.3. Porter's five forces analysis
3.4. Market dynamics
3.4.1. Drivers
3.4.2. Restraints
3.4.3. Opportunities
3.5. Average Selling Price
3.6. Market Share Analysis
3.7. Brand Share Analysis
3.8. Trade Data Analysis
3.9. Value Chain Analysis
3.10. Key Players Details
3.11. Pricing Analysis
3.12. Key Regulation Analysis
3.13. Regulatory Guidelines
3.14. Patent Landscape
CHAPTER 4: AGRICULTURAL COMMODITY MARKET, BY PRODUCT
4.1. Overview
4.1.1. Market size and forecast
4.2. Cereals
4.2.1. Key market trends, growth factors and opportunities
4.2.2. Market size and forecast, by region
4.2.3. Market share analysis by country
4.3. Grains
4.3.1. Key market trends, growth factors and opportunities
4.3.2. Market size and forecast, by region
4.3.3. Market share analysis by country
4.4. Oilseeds
4.4.1. Key market trends, growth factors and opportunities
4.4.2. Market size and forecast, by region
4.4.3. Market share analysis by country
4.5. Pulses
4.5.1. Key market trends, growth factors and opportunities
4.5.2. Market size and forecast, by region
4.5.3. Market share analysis by country
4.6. Others
4.6.1. Key market trends, growth factors and opportunities
4.6.2. Market size and forecast, by region
4.6.3. Market share analysis by country
CHAPTER 5: AGRICULTURAL COMMODITY MARKET, BY NATURE
5.1. Overview
5.1.1. Market size and forecast
5.2. Organic
5.2.1. Key market trends, growth factors and opportunities
5.2.2. Market size and forecast, by region
5.2.3. Market share analysis by country
5.3. Conventional
5.3.1. Key market trends, growth factors and opportunities
5.3.2. Market size and forecast, by region
5.3.3. Market share analysis by country
CHAPTER 6: AGRICULTURAL COMMODITY MARKET, BY DISTRIBUTIONAL CHANNEL
6.1. Overview
6.1.1. Market size and forecast
6.2. Hypermarkets/Supermarkets
6.2.1. Key market trends, growth factors and opportunities
6.2.2. Market size and forecast, by region
6.2.3. Market share analysis by country
6.3. Convenience Stores
6.3.1. Key market trends, growth factors and opportunities
6.3.2. Market size and forecast, by region
6.3.3. Market share analysis by country
6.4. E-commerce
6.4.1. Key market trends, growth factors and opportunities
6.4.2. Market size and forecast, by region
6.4.3. Market share analysis by country
6.5. Others
6.5.1. Key market trends, growth factors and opportunities
6.5.2. Market size and forecast, by region
6.5.3. Market share analysis by country
CHAPTER 7: AGRICULTURAL COMMODITY MARKET, BY REGION
7.1. Overview
7.1.1. Market size and forecast By Region
7.2. North America
7.2.1. Key market trends, growth factors and opportunities
7.2.2. Market size and forecast, by Product
7.2.3. Market size and forecast, by Nature
7.2.4. Market size and forecast, by Distributional Channel
7.2.5. Market size and forecast, by country
7.2.5.1. U.S.
7.2.5.1.1. Market size and forecast, by Product
7.2.5.1.2. Market size and forecast, by Nature
7.2.5.1.3. Market size and forecast, by Distributional Channel
7.2.5.2. Canada
7.2.5.2.1. Market size and forecast, by Product
7.2.5.2.2. Market size and forecast, by Nature
7.2.5.2.3. Market size and forecast, by Distributional Channel
7.2.5.3. Mexico
7.2.5.3.1. Market size and forecast, by Product
7.2.5.3.2. Market size and forecast, by Nature
7.2.5.3.3. Market size and forecast, by Distributional Channel
7.3. Europe
7.3.1. Key market trends, growth factors and opportunities
7.3.2. Market size and forecast, by Product
7.3.3. Market size and forecast, by Nature
7.3.4. Market size and forecast, by Distributional Channel
7.3.5. Market size and forecast, by country
7.3.5.1. Germany
7.3.5.1.1. Market size and forecast, by Product
7.3.5.1.2. Market size and forecast, by Nature
7.3.5.1.3. Market size and forecast, by Distributional Channel
7.3.5.2. UK
7.3.5.2.1. Market size and forecast, by Product
7.3.5.2.2. Market size and forecast, by Nature
7.3.5.2.3. Market size and forecast, by Distributional Channel
7.3.5.3. France
7.3.5.3.1. Market size and forecast, by Product
7.3.5.3.2. Market size and forecast, by Nature
7.3.5.3.3. Market size and forecast, by Distributional Channel
7.3.5.4. Spain
7.3.5.4.1. Market size and forecast, by Product
7.3.5.4.2. Market size and forecast, by Nature
7.3.5.4.3. Market size and forecast, by Distributional Channel
7.3.5.5. Italy
7.3.5.5.1. Market size and forecast, by Product
7.3.5.5.2. Market size and forecast, by Nature
7.3.5.5.3. Market size and forecast, by Distributional Channel
7.3.5.6. Rest of Europe
7.3.5.6.1. Market size and forecast, by Product
7.3.5.6.2. Market size and forecast, by Nature
7.3.5.6.3. Market size and forecast, by Distributional Channel
7.4. Asia-Pacific
7.4.1. Key market trends, growth factors and opportunities
7.4.2. Market size and forecast, by Product
7.4.3. Market size and forecast, by Nature
7.4.4. Market size and forecast, by Distributional Channel
7.4.5. Market size and forecast, by country
7.4.5.1. China
7.4.5.1.1. Market size and forecast, by Product
7.4.5.1.2. Market size and forecast, by Nature
7.4.5.1.3. Market size and forecast, by Distributional Channel
7.4.5.2. Japan
7.4.5.2.1. Market size and forecast, by Product
7.4.5.2.2. Market size and forecast, by Nature
7.4.5.2.3. Market size and forecast, by Distributional Channel
7.4.5.3. India
7.4.5.3.1. Market size and forecast, by Product
7.4.5.3.2. Market size and forecast, by Nature
7.4.5.3.3. Market size and forecast, by Distributional Channel
7.4.5.4. South Korea
7.4.5.4.1. Market size and forecast, by Product
7.4.5.4.2. Market size and forecast, by Nature
7.4.5.4.3. Market size and forecast, by Distributional Channel
7.4.5.5. Australia
7.4.5.5.1. Market size and forecast, by Product
7.4.5.5.2. Market size and forecast, by Nature
7.4.5.5.3. Market size and forecast, by Distributional Channel
7.4.5.6. Rest of Asia-Pacific
7.4.5.6.1. Market size and forecast, by Product
7.4.5.6.2. Market size and forecast, by Nature
7.4.5.6.3. Market size and forecast, by Distributional Channel
7.5. LAMEA
7.5.1. Key market trends, growth factors and opportunities
7.5.2. Market size and forecast, by Product
7.5.3. Market size and forecast, by Nature
7.5.4. Market size and forecast, by Distributional Channel
7.5.5. Market size and forecast, by country
7.5.5.1. Brazil
7.5.5.1.1. Market size and forecast, by Product
7.5.5.1.2. Market size and forecast, by Nature
7.5.5.1.3. Market size and forecast, by Distributional Channel
7.5.5.2. Saudi Arabia
7.5.5.2.1. Market size and forecast, by Product
7.5.5.2.2. Market size and forecast, by Nature
7.5.5.2.3. Market size and forecast, by Distributional Channel
7.5.5.3. UAE
7.5.5.3.1. Market size and forecast, by Product
7.5.5.3.2. Market size and forecast, by Nature
7.5.5.3.3. Market size and forecast, by Distributional Channel
7.5.5.4. South Africa
7.5.5.4.1. Market size and forecast, by Product
7.5.5.4.2. Market size and forecast, by Nature
7.5.5.4.3. Market size and forecast, by Distributional Channel
7.5.5.5. Rest of LAMEA
7.5.5.5.1. Market size and forecast, by Product
7.5.5.5.2. Market size and forecast, by Nature
7.5.5.5.3. Market size and forecast, by Distributional Channel
CHAPTER 8: COMPETITIVE LANDSCAPE
8.1. Introduction
8.2. Top winning strategies
8.3. Product mapping of top 10 player
8.4. Competitive dashboard
8.5. Competitive heatmap
8.6. Top player positioning, 2022
CHAPTER 9: COMPANY PROFILES
9.1. Louis Dreyfus
9.1.1. Company overview
9.1.2. Key executives
9.1.3. Company snapshot
9.2. Cofco
9.2.1. Company overview
9.2.2. Key executives
9.2.3. Company snapshot
9.3. Olam International
9.3.1. Company overview
9.3.2. Key executives
9.3.3. Company snapshot
9.4. Cargill Incorporated
9.4.1. Company overview
9.4.2. Key executives
9.4.3. Company snapshot
9.5. Ag Processing Inc.
9.5.1. Company overview
9.5.2. Key executives
9.5.3. Company snapshot
9.6. Marubeni Corporation
9.6.1. Company overview
9.6.2. Key executives
9.6.3. Company snapshot
9.7. Wilmar International Limited
9.7.1. Company overview
9.7.2. Key executives
9.7.3. Company snapshot
9.8. Archer Daniels Midland
9.8.1. Company overview
9.8.2. Key executives
9.8.3. Company snapshot
9.9. Glencore Agriculture
9.9.1. Company overview
9.9.2. Key executives
9.9.3. Company snapshot
9.10. Bunge Limited
9.10.1. Company overview
9.10.2. Key executives
9.10.3. Company snapshot
LIST OF TABLES
TABLE 01. GLOBAL AGRICULTURAL COMMODITY MARKET, BY PRODUCT, 2022-2032 ($BILLION)
TABLE 02. AGRICULTURAL COMMODITY MARKET FOR CEREALS, BY REGION, 2022-2032 ($BILLION)
TABLE 03. AGRICULTURAL COMMODITY MARKET FOR GRAINS, BY REGION, 2022-2032 ($BILLION)
TABLE 04. AGRICULTURAL COMMODITY MARKET FOR OILSEEDS, BY REGION, 2022-2032 ($BILLION)
TABLE 05. AGRICULTURAL COMMODITY MARKET FOR PULSES, BY REGION, 2022-2032 ($BILLION)
TABLE 06. AGRICULTURAL COMMODITY MARKET FOR OTHERS, BY REGION, 2022-2032 ($BILLION)
TABLE 07. GLOBAL AGRICULTURAL COMMODITY MARKET, BY NATURE, 2022-2032 ($BILLION)
TABLE 08. AGRICULTURAL COMMODITY MARKET FOR ORGANIC, BY REGION, 2022-2032 ($BILLION)
TABLE 09. AGRICULTURAL COMMODITY MARKET FOR Conventional, BY REGION, 2022-2032 ($BILLION)
TABLE 10. GLOBAL AGRICULTURAL COMMODITY MARKET, BY DISTRIBUTIONAL CHANNEL, 2022-2032 ($BILLION)
TABLE 11. AGRICULTURAL COMMODITY MARKET FOR HYPERMARKETS/SUPERMARKETS, BY REGION, 2022-2032 ($BILLION)
TABLE 12. AGRICULTURAL COMMODITY MARKET FOR CONVENIENCE STORES, BY REGION, 2022-2032 ($BILLION)
TABLE 13. AGRICULTURAL COMMODITY MARKET FOR E-COMMERCE, BY REGION, 2022-2032 ($BILLION)
TABLE 14. AGRICULTURAL COMMODITY MARKET FOR OTHERS, BY REGION, 2022-2032 ($BILLION)
TABLE 15. AGRICULTURAL COMMODITY MARKET, BY REGION, 2022-2032 ($BILLION)
TABLE 16. NORTH AMERICA AGRICULTURAL COMMODITY MARKET, BY PRODUCT, 2022-2032 ($BILLION)
TABLE 17. NORTH AMERICA AGRICULTURAL COMMODITY MARKET, BY NATURE, 2022-2032 ($BILLION)
TABLE 18. NORTH AMERICA AGRICULTURAL COMMODITY MARKET, BY DISTRIBUTIONAL CHANNEL, 2022-2032 ($BILLION)
TABLE 19. NORTH AMERICA AGRICULTURAL COMMODITY MARKET, BY COUNTRY, 2022-2032 ($BILLION)
TABLE 20. U.S. AGRICULTURAL COMMODITY MARKET, BY PRODUCT, 2022-2032 ($BILLION)
TABLE 21. U.S. AGRICULTURAL COMMODITY MARKET, BY NATURE, 2022-2032 ($BILLION)
TABLE 22. U.S. AGRICULTURAL COMMODITY MARKET, BY DISTRIBUTIONAL CHANNEL, 2022-2032 ($BILLION)
TABLE 23. CANADA AGRICULTURAL COMMODITY MARKET, BY PRODUCT, 2022-2032 ($BILLION)
TABLE 24. CANADA AGRICULTURAL COMMODITY MARKET, BY NATURE, 2022-2032 ($BILLION)
TABLE 25. CANADA AGRICULTURAL COMMODITY MARKET, BY DISTRIBUTIONAL CHANNEL, 2022-2032 ($BILLION)
TABLE 26. MEXICO AGRICULTURAL COMMODITY MARKET, BY PRODUCT, 2022-2032 ($BILLION)
TABLE 27. MEXICO AGRICULTURAL COMMODITY MARKET, BY NATURE, 2022-2032 ($BILLION)
TABLE 28. MEXICO AGRICULTURAL COMMODITY MARKET, BY DISTRIBUTIONAL CHANNEL, 2022-2032 ($BILLION)
TABLE 29. EUROPE AGRICULTURAL COMMODITY MARKET, BY PRODUCT, 2022-2032 ($BILLION)
TABLE 30. EUROPE AGRICULTURAL COMMODITY MARKET, BY NATURE, 2022-2032 ($BILLION)
TABLE 31. EUROPE AGRICULTURAL COMMODITY MARKET, BY DISTRIBUTIONAL CHANNEL, 2022-2032 ($BILLION)
TABLE 32. EUROPE AGRICULTURAL COMMODITY MARKET, BY COUNTRY, 2022-2032 ($BILLION)
TABLE 33. GERMANY AGRICULTURAL COMMODITY MARKET, BY PRODUCT, 2022-2032 ($BILLION)
TABLE 34. GERMANY AGRICULTURAL COMMODITY MARKET, BY NATURE, 2022-2032 ($BILLION)
TABLE 35. GERMANY AGRICULTURAL COMMODITY MARKET, BY DISTRIBUTIONAL CHANNEL, 2022-2032 ($BILLION)
TABLE 36. UK AGRICULTURAL COMMODITY MARKET, BY PRODUCT, 2022-2032 ($BILLION)
TABLE 37. UK AGRICULTURAL COMMODITY MARKET, BY NATURE, 2022-2032 ($BILLION)
TABLE 38. UK AGRICULTURAL COMMODITY MARKET, BY DISTRIBUTIONAL CHANNEL, 2022-2032 ($BILLION)
TABLE 39. FRANCE AGRICULTURAL COMMODITY MARKET, BY PRODUCT, 2022-2032 ($BILLION)
TABLE 40. FRANCE AGRICULTURAL COMMODITY MARKET, BY NATURE, 2022-2032 ($BILLION)
TABLE 41. FRANCE AGRICULTURAL COMMODITY MARKET, BY DISTRIBUTIONAL CHANNEL, 2022-2032 ($BILLION)
TABLE 42. SPAIN AGRICULTURAL COMMODITY MARKET, BY PRODUCT, 2022-2032 ($BILLION)
TABLE 43. SPAIN AGRICULTURAL COMMODITY MARKET, BY NATURE, 2022-2032 ($BILLION)
TABLE 44. SPAIN AGRICULTURAL COMMODITY MARKET, BY DISTRIBUTIONAL CHANNEL, 2022-2032 ($BILLION)
TABLE 45. ITALY AGRICULTURAL COMMODITY MARKET, BY PRODUCT, 2022-2032 ($BILLION)
TABLE 46. ITALY AGRICULTURAL COMMODITY MARKET, BY NATURE, 2022-2032 ($BILLION)
TABLE 47. ITALY AGRICULTURAL COMMODITY MARKET, BY DISTRIBUTIONAL CHANNEL, 2022-2032 ($BILLION)
TABLE 48. REST OF EUROPE AGRICULTURAL COMMODITY MARKET, BY PRODUCT, 2022-2032 ($BILLION)
TABLE 49. REST OF EUROPE AGRICULTURAL COMMODITY MARKET, BY NATURE, 2022-2032 ($BILLION)
TABLE 50. REST OF EUROPE AGRICULTURAL COMMODITY MARKET, BY DISTRIBUTIONAL CHANNEL, 2022-2032 ($BILLION)
TABLE 51. ASIA-PACIFIC AGRICULTURAL COMMODITY MARKET, BY PRODUCT, 2022-2032 ($BILLION)
TABLE 52. ASIA-PACIFIC AGRICULTURAL COMMODITY MARKET, BY NATURE, 2022-2032 ($BILLION)
TABLE 53. ASIA-PACIFIC AGRICULTURAL COMMODITY MARKET, BY DISTRIBUTIONAL CHANNEL, 2022-2032 ($BILLION)
TABLE 54. ASIA-PACIFIC AGRICULTURAL COMMODITY MARKET, BY COUNTRY, 2022-2032 ($BILLION)
TABLE 55. CHINA AGRICULTURAL COMMODITY MARKET, BY PRODUCT, 2022-2032 ($BILLION)
TABLE 56. CHINA AGRICULTURAL COMMODITY MARKET, BY NATURE, 2022-2032 ($BILLION)
TABLE 57. CHINA AGRICULTURAL COMMODITY MARKET, BY DISTRIBUTIONAL CHANNEL, 2022-2032 ($BILLION)
TABLE 58. JAPAN AGRICULTURAL COMMODITY MARKET, BY PRODUCT, 2022-2032 ($BILLION)
TABLE 59. JAPAN AGRICULTURAL COMMODITY MARKET, BY NATURE, 2022-2032 ($BILLION)
TABLE 60. JAPAN AGRICULTURAL COMMODITY MARKET, BY DISTRIBUTIONAL CHANNEL, 2022-2032 ($BILLION)
TABLE 61. INDIA AGRICULTURAL COMMODITY MARKET, BY PRODUCT, 2022-2032 ($BILLION)
TABLE 62. INDIA AGRICULTURAL COMMODITY MARKET, BY NATURE, 2022-2032 ($BILLION)
TABLE 63. INDIA AGRICULTURAL COMMODITY MARKET, BY DISTRIBUTIONAL CHANNEL, 2022-2032 ($BILLION)
TABLE 64. SOUTH KOREA AGRICULTURAL COMMODITY MARKET, BY PRODUCT, 2022-2032 ($BILLION)
TABLE 65. SOUTH KOREA AGRICULTURAL COMMODITY MARKET, BY NATURE, 2022-2032 ($BILLION)
TABLE 66. SOUTH KOREA AGRICULTURAL COMMODITY MARKET, BY DISTRIBUTIONAL CHANNEL, 2022-2032 ($BILLION)
TABLE 67. AUSTRALIA AGRICULTURAL COMMODITY MARKET, BY PRODUCT, 2022-2032 ($BILLION)
TABLE 68. AUSTRALIA AGRICULTURAL COMMODITY MARKET, BY NATURE, 2022-2032 ($BILLION)
TABLE 69. AUSTRALIA AGRICULTURAL COMMODITY MARKET, BY DISTRIBUTIONAL CHANNEL, 2022-2032 ($BILLION)
TABLE 70. REST OF ASIA-PACIFIC AGRICULTURAL COMMODITY MARKET, BY PRODUCT, 2022-2032 ($BILLION)
TABLE 71. REST OF ASIA-PACIFIC AGRICULTURAL COMMODITY MARKET, BY NATURE, 2022-2032 ($BILLION)
TABLE 72. REST OF ASIA-PACIFIC AGRICULTURAL COMMODITY MARKET, BY DISTRIBUTIONAL CHANNEL, 2022-2032 ($BILLION)
TABLE 73. LAMEA AGRICULTURAL COMMODITY MARKET, BY PRODUCT, 2022-2032 ($BILLION)
TABLE 74. LAMEA AGRICULTURAL COMMODITY MARKET, BY NATURE, 2022-2032 ($BILLION)
TABLE 75. LAMEA AGRICULTURAL COMMODITY MARKET, BY DISTRIBUTIONAL CHANNEL, 2022-2032 ($BILLION)
TABLE 76. LAMEA AGRICULTURAL COMMODITY MARKET, BY COUNTRY, 2022-2032 ($BILLION)
TABLE 77. BRAZIL AGRICULTURAL COMMODITY MARKET, BY PRODUCT, 2022-2032 ($BILLION)
TABLE 78. BRAZIL AGRICULTURAL COMMODITY MARKET, BY NATURE, 2022-2032 ($BILLION)
TABLE 79. BRAZIL AGRICULTURAL COMMODITY MARKET, BY DISTRIBUTIONAL CHANNEL, 2022-2032 ($BILLION)
TABLE 80. SAUDI ARABIA AGRICULTURAL COMMODITY MARKET, BY PRODUCT, 2022-2032 ($BILLION)
TABLE 81. SAUDI ARABIA AGRICULTURAL COMMODITY MARKET, BY NATURE, 2022-2032 ($BILLION)
TABLE 82. SAUDI ARABIA AGRICULTURAL COMMODITY MARKET, BY DISTRIBUTIONAL CHANNEL, 2022-2032 ($BILLION)
TABLE 83. UAE AGRICULTURAL COMMODITY MARKET, BY PRODUCT, 2022-2032 ($BILLION)
TABLE 84. UAE AGRICULTURAL COMMODITY MARKET, BY NATURE, 2022-2032 ($BILLION)
TABLE 85. UAE AGRICULTURAL COMMODITY MARKET, BY DISTRIBUTIONAL CHANNEL, 2022-2032 ($BILLION)
TABLE 86. SOUTH AFRICA AGRICULTURAL COMMODITY MARKET, BY PRODUCT, 2022-2032 ($BILLION)
TABLE 87. SOUTH AFRICA AGRICULTURAL COMMODITY MARKET, BY NATURE, 2022-2032 ($BILLION)
TABLE 88. SOUTH AFRICA AGRICULTURAL COMMODITY MARKET, BY DISTRIBUTIONAL CHANNEL, 2022-2032 ($BILLION)
TABLE 89. REST OF LAMEA AGRICULTURAL COMMODITY MARKET, BY PRODUCT, 2022-2032 ($BILLION)
TABLE 90. REST OF LAMEA AGRICULTURAL COMMODITY MARKET, BY NATURE, 2022-2032 ($BILLION)
TABLE 91. REST OF LAMEA AGRICULTURAL COMMODITY MARKET, BY DISTRIBUTIONAL CHANNEL, 2022-2032 ($BILLION)
TABLE 92. LOUIS DREYFUS: KEY EXECUTIVES
TABLE 93. LOUIS DREYFUS: COMPANY SNAPSHOT
TABLE 94. COFCO: KEY EXECUTIVES
TABLE 95. COFCO: COMPANY SNAPSHOT
TABLE 96. OLAM INTERNATIONAL: KEY EXECUTIVES
TABLE 97. OLAM INTERNATIONAL: COMPANY SNAPSHOT
TABLE 98. CARGILL INCORPORATED: KEY EXECUTIVES
TABLE 99. CARGILL INCORPORATED: COMPANY SNAPSHOT
TABLE 100. AG PROCESSING INC.: KEY EXECUTIVES
TABLE 101. AG PROCESSING INC.: COMPANY SNAPSHOT
TABLE 102. MARUBENI CORPORATION: KEY EXECUTIVES
TABLE 103. MARUBENI CORPORATION: COMPANY SNAPSHOT
TABLE 104. WILMAR INTERNATIONAL LIMITED: KEY EXECUTIVES
TABLE 105. WILMAR INTERNATIONAL LIMITED: COMPANY SNAPSHOT
TABLE 106. ARCHER DANIELS MIDLAND: KEY EXECUTIVES
TABLE 107. ARCHER DANIELS MIDLAND: COMPANY SNAPSHOT
TABLE 108. GLENCORE AGRICULTURE: KEY EXECUTIVES
TABLE 109. GLENCORE AGRICULTURE: COMPANY SNAPSHOT
TABLE 110. BUNGE LIMITED: KEY EXECUTIVES
TABLE 111. BUNGE LIMITED: COMPANY SNAPSHOT
LIST OF FIGURES
FIGURE 01. AGRICULTURAL COMMODITY MARKET, 2022-2032
FIGURE 02. SEGMENTATION OF AGRICULTURAL COMMODITY MARKET,2022-2032
FIGURE 03. TOP IMPACTING FACTORS IN AGRICULTURAL COMMODITY MARKET
FIGURE 04. TOP INVESTMENT POCKETS IN AGRICULTURAL COMMODITY MARKET (2023-2032)
FIGURE 05. BARGAINING POWER OF SUPPLIERS
FIGURE 06. BARGAINING POWER OF BUYERS
FIGURE 07. THREAT OF SUBSTITUTION
FIGURE 08. THREAT OF SUBSTITUTION
FIGURE 09. COMPETITIVE RIVALRY
FIGURE 10. GLOBAL AGRICULTURAL COMMODITY MARKET:DRIVERS, RESTRAINTS AND OPPORTUNITIES
FIGURE 11. PRICING ANALYSIS: AGRICULTURAL COMMODITY MARKET 2022 AND 2032
FIGURE 12. IMPACT OF KEY REGULATION: AGRICULTURAL COMMODITY MARKET
FIGURE 13. PATENT ANALYSIS BY COMPANY
FIGURE 14. PATENT ANALYSIS BY COUNTRY
FIGURE 15. AGRICULTURAL COMMODITY MARKET, BY PRODUCT, 2022 AND 2032(%)
FIGURE 16. COMPARATIVE SHARE ANALYSIS OF AGRICULTURAL COMMODITY MARKET FOR CEREALS, BY COUNTRY 2022 AND 2032(%)
FIGURE 17. COMPARATIVE SHARE ANALYSIS OF AGRICULTURAL COMMODITY MARKET FOR GRAINS, BY COUNTRY 2022 AND 2032(%)
FIGURE 18. COMPARATIVE SHARE ANALYSIS OF AGRICULTURAL COMMODITY MARKET FOR OILSEEDS, BY COUNTRY 2022 AND 2032(%)
FIGURE 19. COMPARATIVE SHARE ANALYSIS OF AGRICULTURAL COMMODITY MARKET FOR PULSES, BY COUNTRY 2022 AND 2032(%)
FIGURE 20. COMPARATIVE SHARE ANALYSIS OF AGRICULTURAL COMMODITY MARKET FOR OTHERS, BY COUNTRY 2022 AND 2032(%)
FIGURE 21. AGRICULTURAL COMMODITY MARKET, BY NATURE, 2022 AND 2032(%)
FIGURE 22. COMPARATIVE SHARE ANALYSIS OF AGRICULTURAL COMMODITY MARKET FOR ORGANIC, BY COUNTRY 2022 AND 2032(%)
FIGURE 23. COMPARATIVE SHARE ANALYSIS OF AGRICULTURAL COMMODITY MARKET FOR Conventional, BY COUNTRY 2022 AND 2032(%)
FIGURE 24. AGRICULTURAL COMMODITY MARKET, BY DISTRIBUTIONAL CHANNEL, 2022 AND 2032(%)
FIGURE 25. COMPARATIVE SHARE ANALYSIS OF AGRICULTURAL COMMODITY MARKET FOR HYPERMARKETS/SUPERMARKETS, BY COUNTRY 2022 AND 2032(%)
FIGURE 26. COMPARATIVE SHARE ANALYSIS OF AGRICULTURAL COMMODITY MARKET FOR CONVENIENCE STORES, BY COUNTRY 2022 AND 2032(%)
FIGURE 27. COMPARATIVE SHARE ANALYSIS OF AGRICULTURAL COMMODITY MARKET FOR E-COMMERCE, BY COUNTRY 2022 AND 2032(%)
FIGURE 28. COMPARATIVE SHARE ANALYSIS OF AGRICULTURAL COMMODITY MARKET FOR OTHERS, BY COUNTRY 2022 AND 2032(%)
FIGURE 29. AGRICULTURAL COMMODITY MARKET BY REGION, 2022 AND 2032(%)
FIGURE 30. U.S. AGRICULTURAL COMMODITY MARKET, 2022-2032 ($BILLION)
FIGURE 31. CANADA AGRICULTURAL COMMODITY MARKET, 2022-2032 ($BILLION)
FIGURE 32. MEXICO AGRICULTURAL COMMODITY MARKET, 2022-2032 ($BILLION)
FIGURE 33. GERMANY AGRICULTURAL COMMODITY MARKET, 2022-2032 ($BILLION)
FIGURE 34. UK AGRICULTURAL COMMODITY MARKET, 2022-2032 ($BILLION)
FIGURE 35. FRANCE AGRICULTURAL COMMODITY MARKET, 2022-2032 ($BILLION)
FIGURE 36. SPAIN AGRICULTURAL COMMODITY MARKET, 2022-2032 ($BILLION)
FIGURE 37. ITALY AGRICULTURAL COMMODITY MARKET, 2022-2032 ($BILLION)
FIGURE 38. REST OF EUROPE AGRICULTURAL COMMODITY MARKET, 2022-2032 ($BILLION)
FIGURE 39. CHINA AGRICULTURAL COMMODITY MARKET, 2022-2032 ($BILLION)
FIGURE 40. JAPAN AGRICULTURAL COMMODITY MARKET, 2022-2032 ($BILLION)
FIGURE 41. INDIA AGRICULTURAL COMMODITY MARKET, 2022-2032 ($BILLION)
FIGURE 42. SOUTH KOREA AGRICULTURAL COMMODITY MARKET, 2022-2032 ($BILLION)
FIGURE 43. AUSTRALIA AGRICULTURAL COMMODITY MARKET, 2022-2032 ($BILLION)
FIGURE 44. REST OF ASIA-PACIFIC AGRICULTURAL COMMODITY MARKET, 2022-2032 ($BILLION)
FIGURE 45. BRAZIL AGRICULTURAL COMMODITY MARKET, 2022-2032 ($BILLION)
FIGURE 46. SAUDI ARABIA AGRICULTURAL COMMODITY MARKET, 2022-2032 ($BILLION)
FIGURE 47. UAE AGRICULTURAL COMMODITY MARKET, 2022-2032 ($BILLION)
FIGURE 48. SOUTH AFRICA AGRICULTURAL COMMODITY MARKET, 2022-2032 ($BILLION)
FIGURE 49. REST OF LAMEA AGRICULTURAL COMMODITY MARKET, 2022-2032 ($BILLION)
FIGURE 50. PRODUCT MAPPING OF TOP 10 PLAYERS
FIGURE 51. COMPETITIVE DASHBOARD
FIGURE 52. COMPETITIVE HEATMAP: AGRICULTURAL COMMODITY MARKET
FIGURE 53. TOP PLAYER POSITIONING, 2022
- Not Sure / Need Reassuring
- Confirm Content
-
Content is provided by our partners and every effort is made to make Market Report details as clear as possible. If you are not sure the exact content you require is included in this study you can Contact us to double check. To do this you can:
Use the ‘? ASK A QUESTION’ below the license / prices and to the right of this box. This will come directly to our team who will work on dealing with your request as soon as possible.
Write to directly on support@scotts-international.com with details. Please include as much information as possible including the name of report or link so our staff will be able to work on you request.
Telephone us directly on 0048 603 394 346 and an experienced member of team will be on hand to answer.
-
- Sample Pages
-
With the vast majority of our partners we can obtain Sample Pages to support your decision. This is something we can arrange without revealing your personal details.
It is important to note that we will not be able to provide you the exact data or statistics such as Market Size and Forecasts. Sample pages usually confirm the layout or the Categories included in Charts and Graphs, excluding specific data.
To ask for Sample Pages by contact us through ‘? ASK A QUESTION’, support@scotts-international.com, or by telephoning 0048 603 394 346.
-
- Check for Alternatives
-
Whilst we try to make our online platform as easy to use as possible there is always the possibility that a better alternative has not been found in your search.
To avoid this possibility Contact us through ‘? ASK A QUESTION’, support@scotts-international.com, or by telephoning 0048 603 394 346 and a Senior Team Member can review your requirements and send a list of possibilities with opinions and recommendations.
-
- Confirm Content
- Prices / Formats / Delivery
- Prices
-
All prices are set by our partners and should be exactly the same as those listed on their own websites. We work on a Revenue share basis ensuring that you never pay more than what is offered elsewhere.
Should you find the price cheaper on another platform we recommend you to Contact us as we should be able to match this price. You can Contact us though through ‘? ASK A QUESTION’, support@scotts-international.com, or by telephoning 0048 603 394 346.
-
- Discounts
-
As we work in close partnership with our Partners from time to time we can secure discounts and assist with negotiations, this is part of our personalised service to you.
Discounts can sometimes be arranged for speedily placed orders; multiple report purchases or Higher License purchases.
To check if a Discount is possible please Contact our experienced team through ‘? ASK A QUESTION’, support@scotts-international.com, or by telephoning 0048 603 394 346.
-
- Available Currencies
-
Most Market Reports on our platform are listed in USD or EURO based on the wishes of our Partners. To avoid currency fluctuations and potential price differentiations we do not offer the possibility to change the currency online.
Should you wish to pay in a different currency to that advertised online we do accept payments in USD, EURO, GBP and PLN. The price will be calculated based on the relevant exchange rate taken from our National Bank.
To pay in a different above currency to that advertised online please Contact our team and a quotation will be sent within a couple of hours with payment details.
-
- Licenses
-
License options vary from Partner to Partner as is usually based on the number of Users that will benefitting from the report. It is very important that License ordered is not breached as this could have potential negative consequences for you individually or your employer.
If you have questions or need confirmation about the specific license we recommend you to Contact us and a detailed explanation will be provided.
-
- Global Site License
-
The Global Site License is the most comprehensive license available. By selecting this license, the Market Report can be shared with other ‘Allowed Users’ and any other member of staff from the same organisation regardless of geographic location.
It is important to note that this may exclude Parent Companies or Subsidiaries.
If you have questions or need confirmation about the specific license we recommend you to Contact us and a detailed explanation will be provided.
-
- Formats
-
The most common format is PDF, however in certain circumstances data may be present in Excel format or Online, especially in the case of Database or Directories. In addition, for certain higher license options a CD may also be provided.
If you have questions or need clarification about the specific formats we recommend you to Contact us and a detailed explanation will be provided.
-
- Delivery
-
Delivery is fulfilled by our partners directly. Once an order has been placed we inform the partner by sharing the delivery email details given in the order process.
Delivery is usually made within 24 hours of an order being placed, however it may take longer should your order be placed prior to the weekend or if otherwise specified on the Market Report details page. Additionally, if details have been not fully completed in the Order process a delay in delivery is possible.
If a delay in delivery is expected you will be informed about it immediately.
-
- Shipping Charges
-
As most Market Reports are delivered in PDF format we almost never have to add additional Shipping Charges. If, however you are ordering a Higher License service or a specific delivery format (e.g. CD version) charges may apply.
If you are concerned about additional Shipping Charges we recommend you to Contact us to double check.
-
- Prices
- Ordering
- By Credit Card
-
We work in Partnership with PayU to ensure payments are made securely in a fast and effortless way. PayU is the e-payments division of Naspers.
Naspers operates in over 133 International Markets and ranks 3rd Globally in terms of the number of e-commerce customers served.
For more information on PayU please visit: https://www.payu.pl/en/about-us
-
- By Money Transfer
-
If you require an invoice prior to payment, this is possible. To ensure a speedy delivery of the Market Report we require all relevant company details and you agree to maximum payment terms of 30 days from receipt of order.
With our regular clients deliver of the Market Report can be made prior to receiving payment, however in some circumstances we may ask for payment to be received before arranging for the Market Report to be delivered.
-
- By Credit Card
- Security
- Website security
-
We have specifically partnered with leading International companies to protect your privacy by using different technologies and processes to ensure security.
Everything submitted to Scotts International is encrypted via SSL (Secure Socket Layer) and all personal information provided to Scotts International is stored on computer systems with limited access in controlled environments.
-
- Credit Card Security
-
We partner with PayU (https://www.payu.pl/en/about-us) to ensure all credit card payments are made securely in a fast and effortless way.
PayU offers 250+ various payment channels and eWallet services across 4 continents allowing buyers to pay electronically, whether on a computer or a mobile device.
-
- Website security